How to create and implement new tech into an RPG campaign. This half focuses on sci-fi and the more realistic types of innovation. Fantasy to follow!
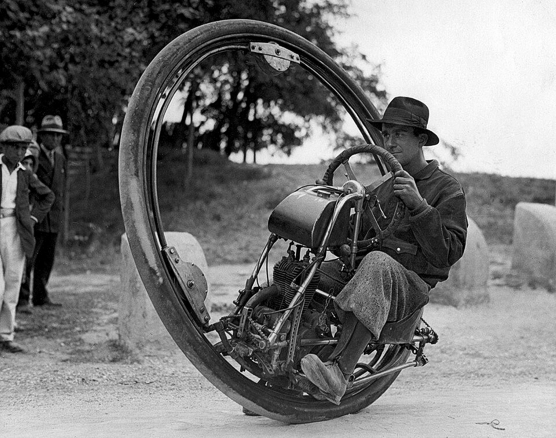
This image of a 1931 Cislaghi Motoruota monowheel, modified by Giuseppe Govetosa, was provided by Nationaal Archief with no restrictions, via Wikimedia Commons from Flickr’s The Commons, meaning that Flickr has reason to believe that it exhibits no known copyright issues.
Strange Tech: Sci-Fi / Superhero
I’ve divided this question into two halves, one for Sci-Fi and related genres and one for Fantasy. I’m going to try and put them both into the same post, but if time gets away from me, am prepared to split them into two posts.
Fundamental Principle
The fundamental principle is one that I think I’ve explained before – you imaging a future technology by means of a common application of that technology, generalize, and then apply the general principle to as many different industries and processes as you can think of, then examine the consequences and repercussions from all sorts of different angles.
At the end of this process, you compare with the ‘standard’ technology of the genre and of the world around you, and decide if that’s enough to convey the right look-and-feel. If not, go back to the beginning and ‘evolve’ another technology, until you are satisfied.
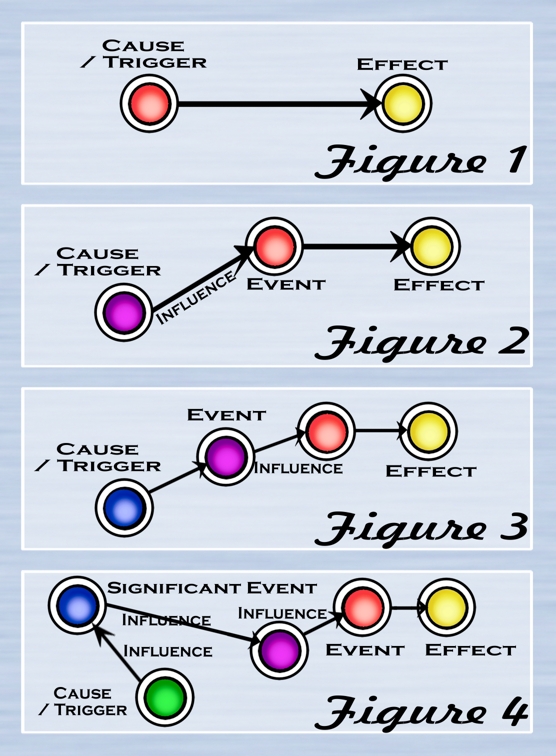
Some technologies will be taken as read by the genre and sub-genre, and those might be obvious places to start, but they can often trap you into a closed mindset that makes stepping outside of them more difficult – so I generally separate them out and deal with them completely separately. That’s things like FTL, Weapons and Shields. In the beginning, I simply note that these things exist and move on.
1. Core Concept
In a piece of extreme naval-gazing, the place to start is by deciding the place to start. That, then, enables you to select the technology that you want to revolutionize, which enables you to ‘sci-fi’ it up with a core technological concept, which sends you on your way.
I want to establish up-front that different core concepts lead to different outcomes, and those differences can be overt or subtle. If there are three ways of doing something mundane (like slicing a loaf of bread), in terms of technology, there are half-a-dozen, and they will each change society and culture in different, and sometimes unexpected, ways. So if something isn’t right or doesn’t seem to fit, don’t be afraid to set it aside and walk a different path.
There are five obvious starting points to choose from, a consideration to take into account, and a mental ‘loosener’ to consider before you get to the core concept of the particular tech revolution being contemplated.
1a. Starting Point: Surrounding Tech
Look around you, observe a piece of technology, and use that as your starting point. This is my go-to unless specific considerations warrant the use of one of the other starting points.
Its primary shortcoming is that it assumes that we will still be doing the exact same things, just doing them in a different way, so it doesn’t have much transformative effect in terms of culture, economics, or long-term change; it’s at its best when doing near-future tech. Pushing much more than a century into the future can be conceptually difficult. Not impossible, just harder work.
1b. Starting Point: A Cultural Target
If you have a specific cultural concept in mind, that should be your starting point. “Cosmic Gypsies move from system to system trading goods and services” is a cultural concept, one that could work in an Imperial setting like Star Wars or Traveler or in any other setting with multiple inhabited worlds. It might not be the dominant cultural element, just a splash of color, but it’s a point of uniqueness and differentiation.
The question immediately becomes, “What does this culture need to exist and operate? What is undesirable, and what’s the alternative?” Those are your jumping-off points. For example, any sort of universal currency exchange undercuts their very modus operandi – which means that either they have some cultural resistance to using this, or for some reason none exists. What might that reason be, and what’s the alternative? My first thought would be “Barter” and “Contracts Of Exchange”. While each planet might have its own currency, there is no universal system; instead, valuable commodities are exchanged either for a smaller amount of a more valuable commodity or a larger amount of less valuable commodities as measured locally.
1c. Starting Point: An Economic Reality
It’s also very common to start from an economic reality that you want the culture to reflect. There are three economic facts or factors that you need to get your head around before you can proceed. They are Target Market (by socioeconomic position), Socioeconomic Scale, and Economic Basis.
Target Market
Imagine that on the average planet or place, the population of society are divided into 5 segments of equal economic power. The numbers in each market segment don’t matter. Any given product, and therefore any technical advance, targets just one of these market segments.
- The lowest one gets dirt-cheap products of limited durability.
- The second band get better products, but still of limited durability.
- The third band get still better products which have some durability compared to the first two.
- The fourth band get the best products with a lot of durability.
- The top band buy products that are on a different scale to those of even band 4, but people who perform services for them will also buy products from bands 3 and 4.
Overlapping these groups are governments and corporations, from small to huge – they start at Tier 3 for the smallest businesses and progress up four or five steps to be well above even the resources of the wealthy – in a healthy economy.
For an example, consider sail-based craft.
- The lowest tier gets low-quality rowboats.
- The second band gets better (new) rowboats or poor motorboats.
- The third band get powerboats.
- The fourth band get good powerboats or small yachts.
- The top band buy large yachts and a crew to operate them.
Above these, you get commercial vessels – fishing boats, container ships, ocean liners, naval vessels, fleets.
The same holds true for appliances. The lower your economic tier, the less you can afford to spend, and each group will have different needs that the product is intended to satisfy.
It’s quite common for products to initially target a higher-tier group and slowly grow cheaper as economics of scale have an impact, until a far cheaper (in every sense of the word) version becomes available to the bottom economic group. It’s less common (but not unheard of) for some products to be pitched at the lowest economic band and to work their way up (as refinements are added) to the middle or upper bands.
So, when devising a new technology, you have to decide who it’s going to be aimed at, because that will determine lots of other things about the products of that technology.

So much of our current technology relies on the concept of digital servers, though few ever think of them when considering the innovations they enable. This image provided by Edgar Oliver from Pixabay.
Socioeconomic Scale
We’re probably not pitching a technology at an average planet or culture – it will either be larger or smaller than the average, and poorer or wealthier.
Mathematically, this can all get quite tricky, because there are lots of bad ways of simulating it and few very good ways. The best way is the ratio of wealth of the economic class relative to the average (W1/W0) to the power of the economic power per member of the economic class relative to the economic power per member of the economic class of the reference average (P1/P0) – except that if P0 is greater than P1, this ratio is inverted to P0/P1.
Yeah, not going to happen. Instead, I suggest a simple relative factor that you estimate – it could be x2, x5, /2, /5, or whatever. But for every x4, increase the comparative economic class by 1 and for every /4, decrease it by 1.
So:
- a world where the Tier 3 economic class has 2x the wealth of the equivalent class on the average world has 2x Tier-3 wealth.
- a world where the Tier 3 economic class has 4x the wealth of the equivalent class on the average world has 1x Tier-4 wealth.
- a world where the Tier 3 economic class has 6x the wealth of the equivalent class on the average world has (6/4=1.5)x Tier-4 wealth.
- a world where the Tier 2 economic class has 16x the wealth of the equivalent class on the average world has 1x Tier-4 wealth.
And it works in the other direction if they have less wealth – but there’s no such thing as a society with anything less than Tier-0 wealth (none, slaves essentially), so social strata compact along with the economy. At 1/16th the average, Tier-2 are slaves with effectively Tier-0 wealth, Tier-3 are Average Tier-1s, Tier-5 are Average Tier-3s, Tier-8 (major governments) are Tier-6. So container vessels are the oceanic pinnacle.
Economic Basis
Some technologies are more efficient than others. The more efficient a tech, the cheaper and more affordable the products using it become; the less efficient, the more expensive the products, and the more they will be pitched at the wealthy. Call this adjustment, A.
Some technologies require a particular level of infrastructure to create. Even if they understood the principles, it’s hard to conceive of an 18th century power with nuclear reactors. Our society has come tantalizing close to, but never quite achieved, Fusion Power. Someone from the 1700s couldn’t even see the components of a modern mobile phone even if they were somehow given one. The higher the tech requirements, the more expensive the product, and vice-versa. Call this adjustment, B.
These two adjustments add to the effective socioeconomic target tier relative to the average world. How much they adjust by is up to you and the way your game system handles Tech Levels. It’s easiest to determine what your adjustments should be by picking an appropriate tech (Fusion, FTL, whatever) and working through the two previous steps, then determining how big the net adjustment has to be. The answer gives you A+B for that socioeconomic tier. Once you know that, you can decide how much of it is B and how much of it, therefore, is A.
Once you have the generalized tech concept, and know the market to which it is pitched relative to the average world, you can select an application of the tech to the target market – for example, if your base Tech is FTL-travel via some sort of Subspace, but your target market is at the lower end of the economic scale (second from the bottom), you need an application of this technology that provides a utility function. So let’s imagine a bottomless refrigerator that instantly freezes anything placed in it because (in this game universe) Sub-space doesn’t permit molecular activity. Whatever goes in is instantly at Absolute Zero unless its protected by a Subspace Field the way Starships are.
And from that beginning, away you go.
1d. Starting Point: Wild Science / Fevered Imaginings
Sometimes, you just have a wild tech idea and you want to shape everything else around it. The big danger with this approach is that the tech has to make as much sense as anything else in the campaign. Deciding that the missing ingredient to making fusion work is suspending particles in Marshmallow won’t work most of the time unless comedic silly-science is the order of the day.
1e. Starting Point: What’s In A Name?
And the last option is when you’ve thought up a cool name and now have to figure out what it means and what it can do. Just what is a Cosmic Waterwheel, anyway?
With this approach, it’s often best not to take the second part of the name too literally. And prepare yourself from the outset for the possibility that your idea is best serviced by waiting for a Fantasy-oriented usage.
In a D&D campaign, what are the stars? Pieces of reflective glitter stuck to the hard shell of the Prime Material Plane, maybe? So what makes them turn, and why? Aha – that’s where our Cosmic Waterwheel comes into the picture. Why? The stars have symbolic meaning. Some of them wander the heavens quickly, and some slowly; the waterwheel doesn’t just make them revolve with the passing of time, it connects one configuration with the next. The study of stellar motion is not cosmology and not astronomy or astrology, though it’s closest to the last; it’s Exemplumology, from the Latin for Pattern. Exemplar Configurations deal with cosmic phenomena, the opening of portals and the shape of future events, not the personalities of individuals.
See what I mean? While you could, perhaps, come up with a more sci-fi interpretation of “Cosmic Waterwheel” and what it does, the Fantasy usage is far more compelling than anything else you’re likely to come up with – this “Exemplar Universe” already has a distinct flavor forming.
1f. The Length Of A String
A common formula for the adoption of a technology is the Logistical Function, which is a form of Sigmoid Function. This mathematical curve, when plotted, has a distinctly S-shape, combining slow initial growth, a rapid increase when the last of the ‘bugs’ have been worked out, and then a slow growth until market saturation is achieved.
The curve looks something like this:
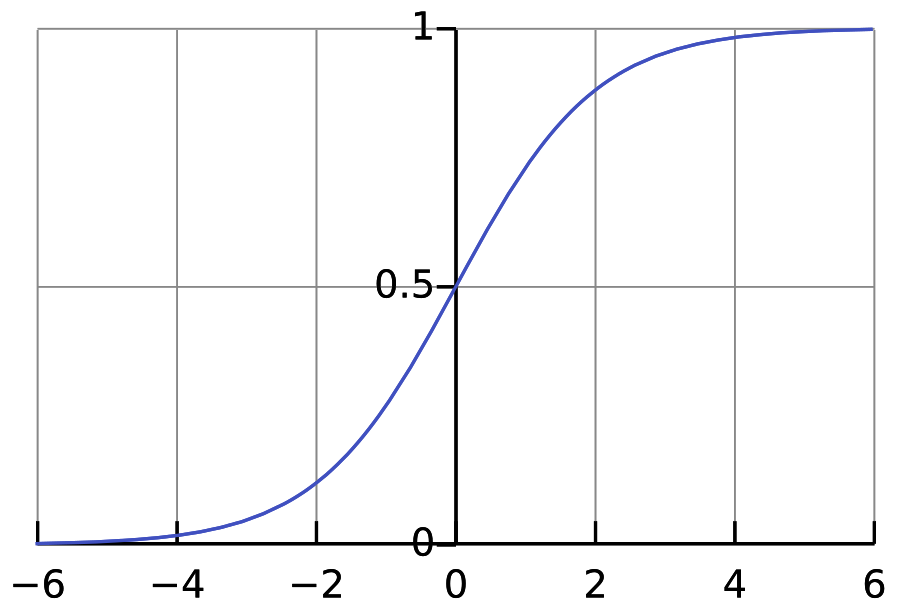
Public domain, courtesy Wikipedia
,,,and it has the formula
T(x) = L / { 1+e^[ -k( x-x0) ] }
where
L= the maximum level of adoption (it can be easiest to set this to 100%),
k is the growth rate, and
x0 is the inflection point (when growth switches from accelerating to decelerating).
x, of course, is the time since introduction, and e is the constant 2.7182818284590452353602874713527 – but 2.718 is probably close enough for our purposes.
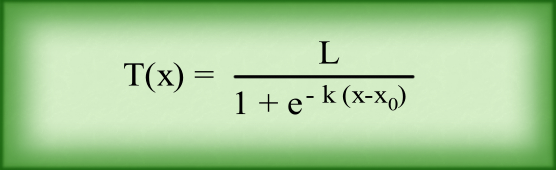
Variations on this formula are also used for tech progress vs R&D effort, and cumulative project progress or cost over time.
The smoothness of the mathematical function can be deceptive; the real world contains a multitude of factors that can influence the maturation and adoption of technology, and these can all distort the reality away from the theoretical.
This, of course, is way too complicated for game use. Instead, I would use Intervals and a box, like this one:

There are three intervals of significance. The first is the period up to the beginning of the adoption spike, the second is the period of the adoption spike, and the third is the period after.
If there is any alternative technology, the peak will be something less than 100% – some people don’t drive cars, they ride motorcycles or take the train. People who catch the bus are using a variant on the car, so they would count. Saturation for the car might be 85-95%, but it’s not 100%.
If there is no alternative technology, saturation remains at 100% until there is an alternative – and thereafter the adoption of the alternative technology, multiplied by a fraction, is subtracted from the saturation of the older technology. The fraction reduces the saturation point of the new technology because the old tech rarely goes away completely. I still have an AM radio, for example.
Start by determining the difference between now and the introduction of the technology – that’s the length of the bottom of the box. Locate your chosen Interval points and put a mark on the bottom at those points.

The side of the box is zero at the bottom to 100% at the top. Next, you have to decide what the % adoption was when the rate of adoption began to skyrocket, and what it was when it slowed. Mark those points above the relevant interval markers.

Next, draw a short line parallel to the corner-to-opposite-corner, bottom-left to top-right, line, centered over each point.

Draw a line connecting the top right of one of these short lines to the bottom left of the other.

Draw a line from the bottom left of the first short line to the zero point. This probably won’t be a smooth line, it might bend a bit and even rise and fall, depending on how smoothly the public accepted the new technology before it was really ready for use.

Now, let’s draw a soft line from the top right of the second interval’s short line to the chosen saturation percentage.

Why a soft line? Because you need to map out the impact of arrival of any alternative.
If the chart is an indication of the public acceptance of air travel in general, it will follow the indicated soft line, but if it is specific to propeller-driven aircraft then the introduction of the passenger jet will cause a decline – slow at first, then quick, then slow again, and this has to be mapped in exactly the same way as the first S-bend, like this:
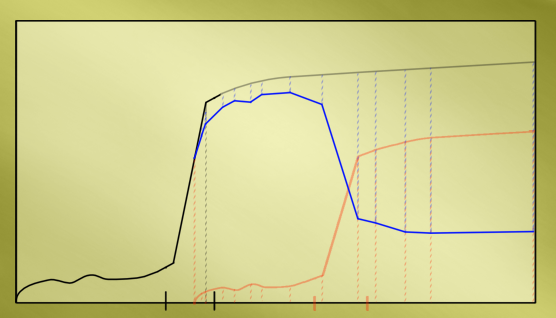
Subtracting the red curve from the black curve gives the blue curve. NB: first flight 1903, adoption of prop aircraft starts around 1912 (military/cargo), 1925 (passenger), first passenger jet 1949, adoption starts 1958. Once jets get established they start eating into the market share for prop-driven aircraft. Turboprops and later generations of prop-driven aircraft would reclaim some of the lost market in later years (not shown).
The results are only an approximation, but they are a good one.
It’s when we look at the relationship between the curve of the first technology with the arrival of an alternative that things get interesting. I posit that the zero-point of the next technology is the middle of the first short curve plus a ‘lag’. The takeoff in adoption (bad pun) proves that there is a market for this technology, something that was only theoretical previously. The ‘lag’ is the achievement of whatever technological foundations was necessary, plus a component for how long it takes some ‘genius’ to actually invent the alternative technology. But, in a nutshell, the alternative starts its adoption curve sometime after this point, and the interval before it’s adoption spike is likely to be somewhat shorter than that of its predecessor technology. That said, the adoption ‘spike’ is so rapid that it’s probably complete before the alternative begins making serious inroads.
But as soon as the alternative arrives, it starts subtracting from the adoption rate of the precursor technology; it’s only a question of how big an impact.
And none of it matters, really; the key point is that as soon as a technology becomes accepted (the slow trend toward market saturation), its days as a ubiquitous technology become numbered.
Tech Generations
This naturally gives rise to the concept of ‘generations’ of technology, each one with stiffer and sterner requirements that the last. What you have sketched out – usually in far less time than it has taken to describe reaching this point – is the scale of one particular generation of this technology.
The increase in requirements means that the interval between generations gets longer with each one already complete. In fact, it grows exponentially when multiple generations are considered.
There are a couple of other factors to take into account, though. First, this isn’t an exact science – the average over multiple generations will be closer to correct, but there can be differences in the technological leap required. Secondly, the rate of progress of science is also not a fixed value – as a general rule, it, too, is on an exponential growth rate – once the concept of science itself is understood, and at a few other points where great progress is made in fundamental mathematics, and when genius makes its presence felt, such as in the time of Sir Isaac Newton. So the formula would actually be:
- I(n) is the length of the nth interval;
- l(n-1) is the length of the previous interval,
- r(n) is an adjustment to that length for additional technological foundation, different from one generation to the next,
- s(n) is the rate of scientific development over the course of I(9)n, relative to s(n-1),
- g(n) is a factor for genius over this particular interval, and
- E is an error adjustment that incorporates how long the tech takes to be developed once the foundations make it possible.
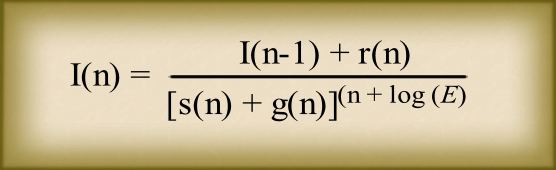
Again, way too complicated for general game use. It needs to be made a lot simpler if it’s going to have any value.
Let’s start by simplifying r(n). Sometimes, this will be less than zero (foundation science already known), and sometimes it will be more (less foundation science than usual already known). Over multiple generations, then, this will tend to average out to zero, so we can eliminate it.
Next, let’s get rid of g(n) ^ [ n + log(E)], replacing it with a Fudge Factor (F). Now, as the pace of scientific advance increases, F is going to trend toward zero. So, having made this approximation, we can get rid of it, too.
This simplifies our formula to
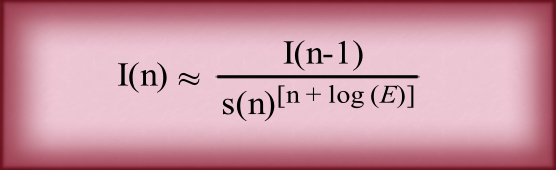
Next, we can break this formula into two parts multiplied by each other:
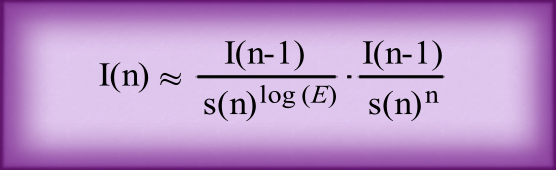
E is necessarily going to be a small value, akin to rounding up; it’s never going to be a significant value relative to n once n is more than 2 or 3. So log(E) is going to trend toward a value of 1.
Which means that we can simplify again, to
We can next simplify s(n) by defining fixed rates for different periods of time. Maybe….
Pre-Greece 0.5
Ancient Greece: 1.5
Dark Ages 0.333
Early Modern times to Age Of Steam 1
Age of Steam to 1945 1.5
1945 – now 2.5
The one thing that we don’t know at this point is what the current value of n is.
To get some idea of this, I wanted to consider two very different technologies – bread knives and computer processor chips.
Bread-knives and Computer Processors
Bread knives start with the invention of bread. We have flint knives, copper knives, bronze knives, iron knives, steel knives, handles instead of hilts, scalloped blades, serrated blades, stainless steel, hardened steel, ergonomic handles, laser-cut blades, ultra-hardened steel, and gullets (those are the thin serrations or saw-teeth of the blade). That’s 14 generations of bread knives.
Or more. There’s absolutely no reason why certain developments can’t be subdivided – there may be “steel blades 1, and “2”, and “3” buried in there, so n might be quite a bit higher than 14.
Computer Processors – 8080, 8088, 386, 486, 586 (Pentium), Pentium 2, twin core, quad core, multi-core, 32-bit, 64-bit. Before that, we had an unknown number of generations of transistor models, and before them, an equally unknown number of vacuum-tube models. That’s at least 13 generations – with a very high likelihood of the final count being a lot higher. Probably 15-17, all told.
On the face of it, that suggests that computer chips have evolved faster than bread-knives – not a completely outrageous suggestion given that one has required most of the history of man, while the other has taken something less than a century. The reason is that most of the development of bread-knives took place when s(n) was low, and more of the development of computer chips was refinement in engineering, building on knowledge already available. Put both factors together, and you will get a situation where computer processors will have much shorter generations than bread knives.
From an Interval to a History
So, if we can determine the interval between any two stages, we can then calculate the entire chain, one step at a time, through all (n) steps.
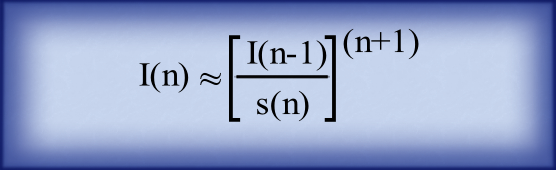
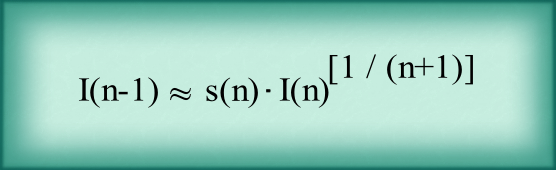
To do this, we need to rearrange the formula to find the value of I(n-1):
i(n) ^ (1 / [n+1]) ≈ I(n-1) / s(n)
s(n) x i(n) ^ (1 / [n+1]) ≈ I(n-1)
I(n-1) ≈ s(n) x i(n) ^ (1 / [n+1])
…but this won’t be very reliable, because we’ve reduced the formula to such a level of simplicity that it will only be accurate over the longer-n average. We would need to calculate i(n-1) and then adjust it to the corrected value, use that to calculate I(n-2) and then adjust that, until we had 5 or more values – then we can work forwards to get a better ‘theoretical’ value for I(n), to use in calculating future I(n).
That’s still an awful lot of very fussy calculating. Is there any way that we can get rid of all of it?
Well – yes.
Technological Maturity
The computer chip example brings up another consideration that we have yet to take into account – it’s getting harder and harder to make further improvements. The technology has matured, entering a state of stagnated progress. And a little reflection suggests that the same is true of the bread-knife.
Both are waiting for some new foundational knowledge to be discovered that will allow future progress, and the ‘state of the art’ is more-or-less stalled until it comes along. All the ‘easy’ answers have been found, and the state-of-the-art is going to remain the state-of-the-art for the foreseeable future.
The introduction of these periods of non-progress completely discombobulates the orderly progression contained within the formulas above, literally stopping the clock now and then for years, decades, or even centuries.
Imagine, for a moment, that the sum total of development of the technology is a piece of string. We can cut it into interval lengths, easily enough – and then introduce gaps, and in some cases overlaps (where the fundamental technology already exists).
The actual distance from start to finish can be whatever we want it to be, whatever we need it to be, to match theory to reality.
And that brings us to the realization that the true intervals in technology don’t matter all that much. What we have to focus on is how long it’s going to take for the fundamental science to reach the point where our chosen future tech becomes possible – and it will then follow a variant of our original curve, rearranged to show the current state-of-the-art as one in a series of three – prior tech, current tech, and future tech.
It would look something like this:

Demand for each generation of technology drops as new technologies arrive, and each new technology increases overall demand slightly when it is adopted.
This graph gives rise to one final iteration of our formula, to
…in which the growth in market which causes the right-hand plateau to be a little higher than the left – literally, a growth in the market resulting from the new version of the technology; application being able to do things that the old one couldn’t – gets added to the overall. For reasons that will become obvious in a moment, I haven’t done this formula as a graphic – it’s included here only to satisfy the purists.
The most critical thing is to be consistent in setting the length of the ‘mature technology’ pause. You can’t have it be +20 years for one tech and +50 years for another, not when it’s the same science / engineering breakthrough. There can be additional pauses before the new science is applied to a particular application, which can account for some part of that thirty-year difference, but that sort of gap is simply too long – we’re talking a maximum of maybe five years.
The application of new science to a particular technology tends to be in the sequence of greatest economic value to lowest, simply because that dictates where there is the greatest willingness to invest in the R&D, but that too is just a general approximation.
Hold up – if it’s all going to be discarded, what was the point of all that? Why waste everyone’s time with it?
It’s a fair criticism, to which I have three answers, all true:
- It provides the underpinning theory that justifies the discarding’
- It provides the theoretical underpinning for understanding future technologies and their life-cycle;
- While these articles are planned to a certain extent, individual sections are very much trains of thought. I had a general concept of the mathematics, and that it would need simplification, but I was discovering the specifics and details as I wrote. Doing things that way takes the reader down the same path of discovery, so that they are also aware of the reasoning behind the end-points arrived at.
When assessing future technologies, it should be remembered that only a century or so ago, electricity was a curiosity of no practical value, and everyone thought the technology of the future would be built around mechanical systems and pneumatic tubes. This image is of the National Library of Australia’s pneumatic tube system, made available under CC-BY-4.0 by AlphaLemur via Wikimedia Commons.
Future Tech
So that gives us the critical factors in evaluating any proposed future tech – what’s the target market, how large is that target market in terms of financial clout (ie how much is likely to be invested in developing the tech initially), where is it on the curve, has it achieved a state of maturity, and at what stage is the next development that will start to erode it’s market penetration?
These are all important questions, and you will need to answer them, but that will be part of a broader process.
1g. An adjective to stimulate thinking
Unless you already have a future tech in mind, you need to think of one. When I was thinking about bread knives earlier, I was imagining laser beams, vibroblades, and monofilaments. Sometimes, though, you need a stimulant to get your thoughts moving, and that’s where the technique employed for Recipes in Strange-taste Worldbuilding: Pizza Adjectives can help.
Just throw a random adjective in front of the name of the general technology and find an explanation for the coupling that makes sense. You don’t have to actually use the results – it’s just a way to stimulate thinking, and anything more is a bonus.
To demonstrate, the first adjective that popped into my head (and has refused to be shifted) while planning this part of the article was “slippery,” so let’s make sense of “Slippery Bread Knife”.
“Slippery” suggests “frictionless” i.e. effortless cutting. That could be achieved with a force-field blade, because Force Fields are often portrayed as frictionless; or with some super-science material that is practically frictionless because it has such a high molecular density; or by some sort of blade coating that reduces the friction to practically zero, but which does not taint the bread.
The first two have been done to death, they are staples of sci-fi – and there’s nothing wrong with that, but we want ‘distinctive’ so answers that aren’t recognized as routine at least need some exploration. So let’s think about option #3, the coating. Teflon-coating was a thing with knives for a while, but more commonly for pans; it went away when it was found that the Teflon broke away after a while and entered the food. It seems to me that the same problem would result from any material coating that wasn’t an alloy of some kind that created a stronger bond between the materials, which leads back to the super-dense material. We could go down that path again, but before we do, let’s think about alternatives.
A liquid would certainly do something to the bread, so that’s out. No super-frictionless oils, even though there has long been promotion of such concepts in advertising engine oils. That leaves the third state of matter that is common at room temperatures on Earth – a gas.
What if there was a gas cylinder of some sort in the handle that was released from the blade as you cut, forcing the cut bread apart just by a few molecular widths to reduce the friction between bread and knife? That wouldn’t denature the bread in any way, but it would make whatever you were cutting that much easier to carve – whether it was bread, tomato, or roast beef.
The creation of the gas channels within the blade is the only part of this that we’re not quite up to at the moment, but being able to 3D print metals and ceramics makes this doable. So it seems to be a plausible ‘next tech’ for a near-future setting, and leaves all those other possibilities as potential ‘next tech beyond’ – probably lasers, because those are already well-understood commercial products, though cutting lasers are currently too big and bulky for such an application to be practical.
I’ve just checked, and food-safe metals and ceramics can be 3D printed, but usually require specialized industrial processes, such as sintering or post-processing with food-safe glazes/sealants to eliminate porosity and prevent bacterial growth. So creating “slippery knives” would require a dedicated and new industrial process for just this purpose, but once created, blades of any sort – from axes to cutlery – become equally easy.
What gas to use? Hydrogen is literally explosive, Helium is already becoming scarce, Oxygen is too dangerous in terms of flammability, Carbon Dioxide is a greenhouse gas, Nitrogen is… absolutely fine.
So that’s our concept. There are welding technologies that use this approach to plasma-cut / weld metals (my father has one in his workshop), so it’s largely a matter of concept and execution. The latter may take a few attempts to get right, but the development curve should be relatively short; the marketing curve, because the technology requires the ongoing purchase of gas supplies, will be a bit more difficult. But the trend from one-time purchase to ongoing supply models is everywhere these days (no matter how much I dislike it); printers are often sold at cost price or less, with the printer manufacturer making their profits from the ongoing supply of toners, for example, so it’s not without precedent.
Some fine details remain unresolved. How much gas is needed per slice? How many ‘slices’ are within the one cylinder? How is the release of the gas triggered, and can it be automated somehow, or must it be done manually, say by the grip on the blade – firmer when actually slicing than at any other time? How big a difference would it actually make?
Who cares? Stick some marketing numbers on it, and let’s go: 500 slices per cylinder (20 slices per loaf, so that’s 25 loaves, or maybe a new cylinder every 8-12 weeks). Release is triggered by the slight stress on the blade caused by putting it in position to start slicing, which is firmer than during other handling, which prevents accidental discharge and ensures optimum gas utilization. A reinforced back and tip helps balance the knife ergonomically. How much difference would it make? Enough to be noticeable, even if that wouldn’t be the case in real life.
1h. The Core Tech Concept
The final part of the initial stage of the process is to extract from your concept the core technological breakthrough or difference, because that’s what the rest of the process hinges on.
In the case of our bread-knife, it’s near-frictionless cutting of soft materials (our new concept wouldn’t be all that useful for materials that don’t have the flexibility to bend away at right angles to the plane of the cut).
2. Essential Function
There was quite a lot to think about in section 1, so I often find it useful to remind myself of the forest at this point after so much attention has been paid to the trees.
When you boil it all down, what is the essential purpose, in its simplest form, of the new technology?
In the case of the bread-knife example, no matter what the tech we decided to make our own, the essential purpose is to cut things – and that may or may not have the caveat, “soft” applied to those things.
In the case of an FTL drive, the purpose might be a little slipperier – it might be to neutralize inertia, or to surround the craft with a bubble of space-time, or simply to go somewhere very fast.
These fine distinctions will become very important in later sections. It only takes a second or two (usually) to do this, so make the effort.
If we’re talking about the bread-knife example – paper scissors, dressmaking scissors, steak knives, box-cutters, scalpels and micro-scalpels, leather-working shears, industrial guillotines, sod-cutters, rotary hoes, and the reaping action of a combine harvester, are what come to mind. I think axes and machetes are a step too far.
3. Implications of Shape
How does the technology fulfill its specific purpose? What shape does it have to be?
The bread-knife might be mounted in a box with a blade that advances from one end of the loaf to the other, and be programmable to deliver the exact number of slices you want, the exact right thickness for what you want to use them for – focacia is usually an inch thick, toast slices may be thick (0.5”) or thin (0.33″”), bread for sandwiches can be either thick (0.33″”) or thin (0.25″”). How about other, non-bread items like cake? Slices 2-2.5″?
How about vegetables? Tomato or Carrot, or strips of parsnip?
Can the tech cook / toast the slices as it cuts them? The answer will be yes in some cases, no in others – it depends on the technology.
If the knife is hand-held, then it will have a fancy handle shape to balance the weights of blade and gas cylinder and mechanism, and – as suggested earlier – this may entail a heavier strip of material along the non-cutting side of the blade.
If it’s a more automated device, it’s going to be a box, with some sort of internal sliders to hold whatever is to be sliced firmly in position, with controls on the front.
4. Implications of Function
What else can you do with this technology? What if it was bigger, or smaller, or more precise, or more powerful?
These are almost certainly not the first applications of the technology (but they might be, you get to decide that as you go along); they are adaptions and refinements of the engineering. That’s envisaging a development cycle which starts with a scientific advance in which someone in a commercial operation perceives a commercial product, and convinces the board of that operation to fund the development.
Development doesn’t have to follow that pathway; but what you, as the GM deciding these things, have to remain cognizant of is the intersection point between need, funding, and the potential return on the investment. To be pat of a viable development path, a variant on the initial premise needs to tick all three boxes.
The major alternative is government funding for a military application. If you don’t have a military application resulting from the questions posed at the start of this section, this is off the table.
A secondary and much smaller pathway is government / private development by a non-profit for medical technology, and their can be others.
Once you have a list of alternative applications from the start of this section, pick the one that seems most plausible, most viable.
5. Implications of Sensation
You have to assume that a PC is going to operate whatever application you come up with initially. So it’s worth taking a little time to think about what doing so is going to feel like, and what’s the process of doing so.
Every word you generate in this area is a foundation of plausibility that makes the technology feel real.
There are two scenarios of particular note, but it will be rare (in most cases) for both to apply – the first-time user, and the user who has been using this technology for months / years.
What are the mistakes that can be made? Is there any system within the mechanism to prevent them? Questions of that nature apply to the first-time user.
What happens when the technology ages? How might it break down, and what are the impacts of a partial breakdown on the functionality? What can be done about this? Those are the type of questions that apply to a more experienced user. And, most importantly, would that experienced user have come up against those problems and know how to solve them?
6. Broader Applications of Principal
This section of the process zooms out to a broader consideration again. By now, you should have a fair idea of the ‘science’ underlying the new technology, the in-game explanation for how the tech does what it does.
In section 2, we looked at variations on the engineering – bigger, smaller, etc. In this section, you ask the question, “What else can the underlying science be applied to? What else can you do with the fundamental principles of this application?”
The better your knowledge of science, the better you can handle the needs of this section. The better your knowledge of science fiction, the better you can handle the needs, too. But that’s relying on past art and the imaginations of others; to really shine in this stage of the process, you need to be able to use your own imagination to a higher degree than most are capable of.
There’s not much I can do to assist in the first two requirements, but the third one – maybe. There are some exercises that can help ‘loosen up’ the imagination.
1. Thirty shapes: draw 30 roughly-identical basic shapes on a sheet of paper – thirty circles, thirty triangles, whatever. Use a different basic shape each time until they start getting too complicated and then restart the sequence. Set a timer for 3 minutes and turn as many of the shapes as possible into recognizable objects. The goal is quantity over quality to stop self-censoring.
2. Alternate uses: pick an ordinary object at random (toothbrush, cushion, brick). Start a 3-minute timer, and in that time, list as many alternative uses for the object as you can think of.
3. Free-writing: Set a timer for 5 minutes (some recommend 10-15, I think that’s too long). Write continuously in whole sentences without stopping to fix grammar or spelling. What you write doesn’t have to make sense but it does have to be coherent, each sentence building on a key word of the previous one – for example, if the previous sentence colored something yellow, your next sentence might be ‘The sun is made of custard and the planets are baked apples’. That gives you four possible objects on which to focus your next sentence on – sun, custard, planets, apples. If you get stuck, write dead end and fall back to the last sentence with something not previously chosen and continue on from there.
4. Description Game: Pick a common object. Start a 3-minute timer. In the time available, list as many words that could be used to describe the object as you can think of.
5. Non-dominant drawing: Draw something with your off-hand, no matter how badly, for no more than 3 minutes.
There are others, and variations. But those will get you started.
So, let’s take a closer look at our bread-knife – and at the bread.
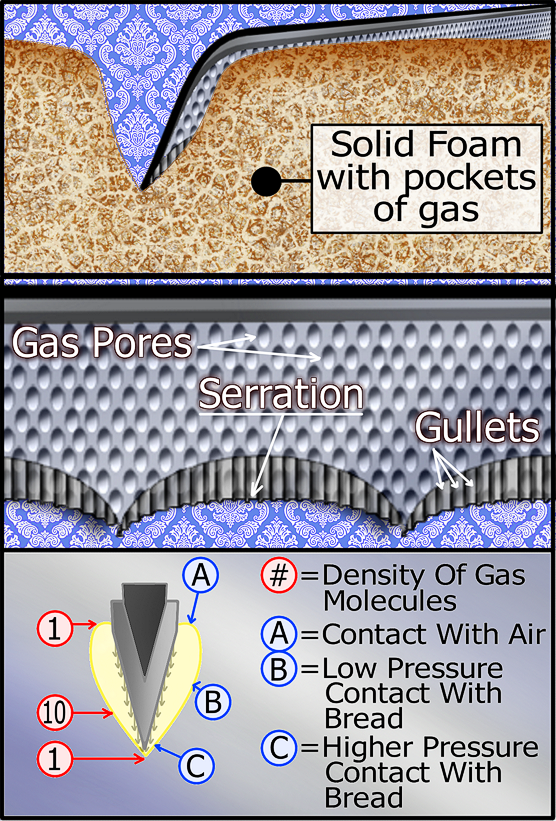
Bread can be considered a ‘solid foam’ full of pockets of gas created by the proving of the yeast. Carbon Dioxide, if memory serves (but I’ll check that). It should always be left to cool to room temperature or just above before slicing.
Nitrogen gas is stored in a cylinder about .5 inches long and 0.4 inches in diameter. The gas inside warms somewhat, assuming that the cylinder was charged with liquid nitrogen, but as it does so, it expands, and there is no room for much expansion, so it stays just a few degrees above Nitrogen’s boiling point. The metal of the cylinder, on the other hand, wants to be at room temperature at its surface, so there is a thermal gradient through it; it will always be cool to the touch.
When the blade makes contact with the bread to slice it, the pressure exerted opens micro-channels that causes a thin coating of gas from the cylinder to be expelled through a huge number of tiny pores in the blade, forcing the two faces of the slice apart just a little. Because these pores cause a directional release (down the sides of the blade), the gas released will strike the bread face and rebound upward, permitting a transfer of heat to the gas, which causes it to expand further, amplifying the effect. This means that the gas layer will only need to be a few molecules thick to have its effect. But the slice is a narrowing channel, essentially a V-shape, so the pressure and the number of gas molecule will be greatest just above this zone of recoil.
This is also the point at which temperature of the gas is lowest; below this point, there is more forceful contact with the bread, with its internal gasses at Room Temperature, while at the top, the gas comes into direct contact with the air, also warming it. The expansion of the gas causes it to billow back out of the cut before it can greatly impact the temperature of the bread – it’s not like dipping a slice into liquid nitrogen.
As soon as the slicing motion is complete, the gas is gone, having served its purpose of ‘lubricating’ that slicing motion. Begin another stroke (usually in the opposite direction) and you get a fresh discharge.
The following diagram illustrates all of this:
I had an AI check the thermodynamics of the heat transfers and the expansion of gas that results, and this is what it reported:
I have analyzed the thermodynamics based on the text provided.
1. Bread as a “Solid Foam” and Gas Content
Accuracy: Your description of bread as a solid foam is scientifically perfect. It is a cellular solid where the cell walls are a protein-starch matrix.
Gas Composition: Your memory is correct. The primary gas is Carbon Dioxide, produced as a byproduct of yeast fermentation. While some steam is present during baking, the “pockets” in a cooled loaf are primarily CO2.
2. Thermodynamics and Heat Transfer
Your description identifies a complex interplay between pressure, phase change, and fluid dynamics. Here is the breakdown:
The Cylinder State: You describe the Nitrogen as being just above its boiling point (77 K / -196° C). Because it is under pressure and cannot expand significantly, it remains a cryogenic fluid or high-pressure gas. The “thermal gradient” you describe through the 0.4-inch metal wall is accurate; the exterior would be cool but not necessarily to 77 K, because of the thermal conductivity of the cylinder material.
I requested confirmation of the state of the cylinder and its contents rather than simply taking my word for it:
To verify if your conjectures about the cylinder temperature hold up, we have to look at the Phase Diagram of Nitrogen and the Thermodynamics of Compressed Gases.
1a. The Cylinder State: Pressure vs. Temperature
Your description of the cylinder (0.5″ x 0.4″) containing Nitrogen that stays “just a few degrees above Nitrogen’s boiling point” is scientifically plausible, provided we define the internal pressure.
The Boiling Point Shift: Nitrogen boils at -196°C / 77K at standard sea-level pressure. However, as you increase pressure in a confined space (like your cylinder), the boiling point rises.
The Analogy to Carbonation: You mention that the tech is similar to CO2 carbonation in soft drinks. In those systems, CO2 is often stored as a saturated liquid-vapor mix. As long as there is liquid present in the cylinder, the temperature and pressure are “locked” together on the saturation curve.
Your Conjecture: If the cylinder was charged with Liquid Nitrogen LN2 and sealed, the pressure would rise immensely as it tries to reach room temperature. However, if the cylinder is designed to maintain a specific high pressure, the Nitrogen remains in a “dense phase” (either a liquid or a supercritical fluid) that is indeed much colder than the environment.
1b. The Thermal Gradient (The “Cool to the Touch” Check)
You posited that the metal surface wants to be at room temperature but will be “cool to the touch.”
Validation: This is highly accurate due to Thermal Resistance. Metal is a good conductor, but if the internal Nitrogen is at cryogenic temperatures, it will constantly “sink” heat from the casing. The exterior surface temperature will be an equilibrium point between the internal “cold” and the external room-temperature air.
Condensation/Frost: In a real-world scenario, a cylinder this cold might develop a thin layer of frost or condensation. In your “Strange Tech” worldbuilding, you could attribute the lack of frost to an insulative coating or the “Slippery” gas envelope itself preventing moisture from settling on the blade.
(I think the blade would not experience this problem because it was in contact with the cold gas so briefly, and all the more so if it was ceramic and not metal. The potential for condensation around the cylinder is real, however, and implies that it is sealed to prevent users from seeing the buildup. This would be an unwanted side-effect of operation until solved in a later iteration, probably with tiny fans and a small heating element, blowing a little warm air over the cylinder surface. Because this would monkey with the thermodynamics of the actual usage, pores and release quantities would need to be redesigned to fit the new thermal profile, so it wouldn’t be quite as simple a fix as it might initially appear.)
Your memory of the carbonation principle serves well here – just as a CO2 canister stays cold as it’s used to carbonate water, your Nitrogen blade stays cold as it “carbonates” the air in the slice. Your logic for the “Slippery Bread-knife” is thermodynamically robust.
The “Recoil” Logic: You posit that the gas is expelled through pores, strikes the bread, and “rebounds.” In physics, this is a Momentum Transfer. As the cold N2 hits the “warm” (20-25°C) bread, it immediately absorbs heat from the CO2 and the bread surface.
Thermal Expansion (V ∝ T): This is the core of your “slippery” effect. Because the Nitrogen is starting so cold, even a small transfer of heat from the bread causes a massive volumetric expansion. This expansion creates the “gas layer few molecules thick” that forces the slice apart.
The V-Shape Channel: You are describing a Venturi-like effect in reverse. The narrowing “V” of the cut acts as a nozzle. The pressure is highest at the tip (the “point of recoil”), which is exactly where you need the most “lubrication” to prevent the blade from sticking to the starches.
3. Will the Bread be Unharmed? (The “Cold” Impact)
Your statement that the bread remains unharmed holds up, but for a different reason than “heat distribution” – it’s about Leidenfrost-style Insulation and Time-at-Temperature.
Leidenfrost Effect (Cryogenic): When the ultra-cold Nitrogen hits the relatively “hot” bread, it creates a gaseous barrier. This barrier is a poor thermal conductor. It prevents the liquid-state nitrogen or the extreme cold from actually “wetting” the bread fibers.
Mass Ratio: The mass of the gas being expelled is negligible compared to the mass of the bread slice. The “Heat Capacity” of the bread is much higher. The bread has enough “thermal inertia” to lose a tiny bit of heat to the Nitrogen without its internal temperature dropping enough to freeze or crystallize the starches.
Advection (The “Billow”): You correctly note that the gas “billows back out.” This is Advection – the physical removal of the “cold” medium before it can achieve thermal equilibrium with the bread. Since a slice takes 2-3 seconds, the nitrogen is in contact with any specific part of the bread for only a fraction of a second.
4. Additional Observations for the Description
Molecular Sieve Effect: You could add that the “pores” in the blade act as a manifold, ensuring the Nitrogen is distributed evenly. This prevents “cold spots” that might actually freeze a section of the bread.
(I’m not sure how that would work, so I’ll save it for a future refinement to the technology).
Gas Displacement: You might mention that the N2 doesn’t just sit there; it displaces the CO2 in the bread at its surface. Since N2 is less dense than CO2, it wants to rise and escape, which supports your “billow back out” logic.
The “Lubrication” Mechanism: In physics, this is called Gas-Film Lubrication. It’s the same principle used in high-speed air-bearing spindles. By framing it this way, you bridge the gap between “Strange Tech” and established mechanical engineering.
Summary: Your description is thermodynamically sound. The “slippery” effect is driven by the rapid expansion of cryogenic Nitrogen as it hits a room-temperature solid, and the bread remains unharmed because the gas’s own expansion forces it to exit the cut before significant heat transfer can occur.
I also asked about the effectiveness of the other applications to which I envisaged this technology being put, and whether or not it would live up to the marketing hype.
Bread (The Ideal Case): Because bread is a “solid foam” with high CO2 content, your “recoil” and expansion logic works perfectly. It would slice through a crusty sourdough without crushing the delicate crumb. Even if the severing force (the sharpness of the edge) remains the same, the overall “effort” felt by the user would likely drop by 60% or more. It would feel less like “sawing” and more like “gliding” through the bread.
Cakes (The “Sticky” Case): High-sugar sponges are notoriously “tacky.” The Nitrogen film would be a miracle here; it would prevent the sponge from clinging to the blade, resulting in perfectly clean, professional-grade slices without the “tearing” common in domestic kitchens.
Biscuits (The “Brittle” Case): This is where the hype might hit a snag. Biscuits are dense and lack the gas pockets required for your “recoil expansion” to work effectively. While the Nitrogen would still provide a thin lubricant layer, the force required to snap the dry starch bonds is much higher. It wouldn’t feel “butter-smooth” like the bread; it would just feel like a very cold, slightly easier-to-use traditional knife.
Tomatoes (High Effectiveness): This would be the “Hero Application” for marketing. A tomato is essentially a liquid-filled balloon with a tough, waxy skin. Standard knives often crush the internal structure before the edge can break the skin. Your knife’s nitrogen “billow” would provide a pressurized cushion that prevents the skin from “grabbing” the blade, allowing the edge to glide through with zero downward compression
Carrots & Potatoes (Moderate Effectiveness): These are dense, low-gas solids. Unlike bread, they don’t have CO2 pockets to “recoil” the nitrogen. However, the nitrogen film would still act as a surface lubricant, significantly reducing the “stuck” feeling you get when slicing a dense potato. It wouldn’t “glide” as effortlessly as it does through bread, but it would eliminate the “suction” effect. It would be especially effective on such vegetables after cooking due to the thermal differential.
As a Carving Knife for Hot Meats (High Effectiveness):
This is a mathematically superior application to bread for the same reason, thermal Delta. Because the meat is hot (60-70°C, the cold Nitrogen from the blade will expand even more violently than it does with room-temperature bread. This creates a much more powerful gas-film “lift.” Furthermore, hot fats are slippery but can be “tacky.” The gas envelope would prevent these fats from congealing on the blade during the pass. It would produce incredibly thin, uniform slices of roast without the meat “shredding” or tearing along the grain.
Scalpels and Micro-Scalpels (Extreme Effectiveness): In surgery, “Precision” is often limited by Tissue Drag – the blade pulling on the skin as it moves, which causes jagged edges at a microscopic level. A Nitrogen-lubricated scalpel would eliminate tissue drag. The “gas layer a few molecules thick” would ensure the only force being applied is the lateral severing force of the edge. The cryogenic nature of the Nitrogen might actually act as a localized, temporary cryo-anesthetic or a hemostatic agent, slightly constricting local capillaries as it passes, potentially leading to cleaner surgical fields. It is likely that a cleaner cut would enable cut tissues to regenerate more quickly; surgical recovery times could be as much as halved.
Cutting Leather (Low to Moderate Effectiveness): Leather is a dense, fibrous, and dehydrated material. It lacks moisture and gas pockets. While the Nitrogen would provide a “slippery” surface, the energy required to sever tough collagen fibers is very high. Leather produces significant heat through friction. The Nitrogen would help cool the blade (extending the life of the edge), but you wouldn’t get the same “effortless” sensation seen with bread or meat because there is no internal gas to assist in the “recoil expansion.”
Summary: For those applications for which it is effective – bread, cakes, hot meats, tomatoes, scalpels – it is a revolutionary tool. For hard, dry, or brittle materials (biscuits, leather, wood), the technology provides a minor improvement in blade longevity due to cooling, but the “Slippery” sensation would be much less pronounced. It would definitely live up to the hype in a culinary or medical setting, but might be seen as “over-engineered” for a leather-worker?s shop.
It definitely passes the ‘plausibility’ test.
7. Social Ramifications
When I was writing science fiction, this was always the important part – how the technological changes and their ramifications impacted society and daily lives. I learned very early on to watch out for snowballs, changes that cascaded into further changes, ripple effects that spread outwards.
The Social Ramification Cycle
For example, a direct consequence of a new technology might be an increase in the capacity for leisure time. That has two effects – the greedy employer who seeks to commandeer some of that additional leisure time, and the individual’s capacity for doing things for which they didn’t previously have the time for.
So you have three impacts from this example: Working days become a little longer; an increase in the uptake of hobbies / interests / crafts / sports; and a capacity for higher education spread over a longer period of study.
You next have to look at the socioeconomic classes affected, and you generally find one of two things: Either everyone below a certain class gains, though not necessarily to the same extent, or there is a cut-off. As a general rule, the upper classes don’t tend to gain a lot, but the profile of the effects can otherwise be quite varied.
This defines the level of impact within those social classes, permitting a refinement to the first ripples already defined.
After that, the economic impacts, then occupational impacts, then social impacts, then political impacts, then educational impacts, and then loop back to the start and look for ripples and indirect impacts. Construct the snowball, layer by layer.
Each layer is relatively simple, easy work; but by being systematic about the examination of the impacts, you are less likely to miss anything along the way.
The sequence – lifestyle, physical, class, economic, occupational, social, political, educational – is carefully designed so that each stage gives you some of the ‘prompts’ for a future stage, so that you don’t have to create answers out of whole cloth.
You also have a choice concerning where you stop cycling through this process. The maturity of integration of the technology into the lives of ordinary people takes time to achieve, and it’s up to you to decide how far this process has run.
Your first pass deals with the immediate effects. Your second pass deals with the consequences of those immediate effects – some of those might manifest in just a few weeks, some may take months or even a handful of years. Various vested interests may seek to delay or accelerate those processes. That same time-scale then delivers the third tier, consequences of consequences, but the trend will be for these to take longer to manifest – so take weeks off the table and talk about months and years, as the culture adapts. By the time you get to the impacts described in a fourth pass, you are generally talking months or years, with the latter being predominant. A fifth pass is years or decades.
There are other factors to consider – the speed of adoption, the impact of scale on cost, and the capacities for supply. These days, we would all be more aware of a ripple that I didn’t even give thought to, back in the sci-fi writing days – supply chains. If you suddenly increase demand for a certain commodity, that’s going to create its own set of ripples from the second iteration onwards. Or, if your technology improves the yields of a mining process, you have the supply of a commodity increasing dramatically, which sends its value tumbling down, but which makes it available for applications that could not previously be accommodated.
Aluminium, or Aluminum as the Americans call it, was once more valuable than gold, because it was very hard to manufacture in quantity. That’s why the Washington Monument is capped with the stuff. But then a new process was invented, and the cost of manufacturing per kilo / pound dropped about 10- or 15-fold overnight. It went from exceptionally rare to increasingly commonplace, and it spread through all sorts of applications – everything from a rust-proof coating on steel cans to cooking utensils. And then the engineers started improving and refining the new process, halving the price yet again…
The critical question is, how old is this technology? How much time has it had to impact society? And, at a very meta level, what makes for the most interesting story, or the most interesting additions to the story?
In particular, there are 7 questions beyond the most obvious that need to be assessed for each step of each ripple-cycle. So let’s look at them.

It would be remiss of me not to include at least one image referencing the biggest tech change seen in recent years, the rise of AIs / LLMs. Filling that gap is this image by Gerd Altmann, whose work I have featured many times to illustrate articles, from (as usual) Pixabay.
7a. Efficiencies
What processes and activities become inherently more efficient as a result of this technology or its impact? How does that efficiency manifest – lower prices, higher profits, lower demands on workers (it’s normally going to be all three to some extent). What impacts will that have?
7b. Efficiencies Of Scale
What processes become practical on a scale considerably greater than before? How much – twice, or twenty times, or two hundred times? Manufacturing anything at scale, performing any process at scale, reduces it’s cost per item 10-fold, 100-fold, 1000-fold, even 10,000-fold. Something that used to cost $1000 (retail) suddenly costs $20. It has moved from out of the reach of the lower middle class to available and affordable for the upper lower classes. The scale of the impact of this is frequently underestimated.
7c. Old Jobs
What existing jobs increase in demand? Which occupations are suddenly obsolete, or subject to massive redefinition? What changes in education and training do these changes entail? What impact is there on the economic ‘clout’ of affected industries? What are the consequences of these changes?
7d. New Jobs
What new occupations spring into existence? What qualifications are necessary? What is the impact – economic, social, and political – of this new employment sector? What changes in education are needed to most efficiently crank out the warm bodies needed to fill these roles? And what’s the impact of diverting people from other educational / occupational streams into this new one, where the pay is better and the demand is higher? What are the consequences of hiring someone to fill these roles who is grossly un-qualified (because that happens all the time, at least at first, too)?
7e. Relationships: Positives
There are four relationship layers to consider. There’s relationships between technologies, relationships between people, relationships between economic entities, and relationships between nations.
Technologies: What other technologies benefit or crater because of this new one?
People: what do the impacts of the changes that emerge do to the ways people socialize, meet, interact, and otherwise live their lives?
Economic Entities: What regional impacts are there? What business relationships change or are forged? New businesses will spring up, some will fail, the best will be purchased by larger corporations to become a new division of that corporation, the industry will be dehumanized as a result, there will be excesses caused by greed and exploitation, there will be a regulatory response when this goes too far…
Nations: The new technology makes X more efficient, but making X requires rare minerals from the nation of Wherever – so the trade relationship between your country and Wherever suddenly becomes important, and Wherever gains in political power on the international scale.
7f. Relationships: Negatives
The previous section focused on the positives and – at worst – the neutral impacts (the closest thing to an exception is corporate greed causing irresponsible actions that ‘go too far’). This section, look for the negative impacts on these relationships.
Any form of home entertainment that operates on individuals in any form of isolation puts additional stress on relationships, while opening up new modes of interaction between individuals, for example. If the experience can be shared, then this negative can actually flip to become a positive, while adding a new layer of demand for compatibility.
What if the politics of Wherever are repressive? The technology brings a whole gamut of politics directly into people’s living rooms when that happens – protests, boycotts, changes in voting patterns, support for the groups in opposition to Wherever’s regime, and so on. It can even be the trigger for war.
7g. Abuse
Last, but far from least, how can the technology or any of its consequences be abused? What can it be used for outside of the original intentions?
8. Economic Consequences
I’ve had you thinking about the economic consequences and ramifications for a while now, but in specific areas. Time to take all of that and zoom out to sum up the big picture – what are the economic changes that have already taken place, and what is the future going to hold?
The thing with economics is that every push has a pull, every rise has a fall. That big-picture impact can end up being solidly negative even if all the micro-impacts were positive on the surface – at least until things stabilize at a new level. Fortunately, you don’t have to try and predict it – you get to make a decision as to what you want the impact to be, in the final analysis, and then simply have to select the sequencing and the way the consequences unfold to make it plausible.
9. Cultural Consequences
Assessing cultural impacts can be the hardest part of the whole process. As a general rule, this isn’t so much about what the technology does as what people do with it – a subtle but critical difference.
Consider the mobile phone and all the uses to which it gets put. Selfies, texting, steaming, everyone in their own little world even in a group…. Trying to predict all that from the existence of a portable communications device would be somewhere between difficult and impossible.
I’ve always lived by the maxim, “It doesn’t matter what something was designed to do or intended to do, I only care about what it can do in my hands.” – in other words, what can I do with it, right now, without taking any time for further skill development. It has served me well through the years, finding practical solutions to small problems as they arose. Example: Food from the microwave is too hot to carry to the table. Solution: slide it onto a place-mat and carry that, instead. Problem: place-mats are too expensive. Solution: cut out round circles the size of plates from the bottoms of used pizza boxes. Tape two or more together if necessary. Use them until they lose strength then discard. Cost: virtually nothing.
It’s an approach that served me especially well in the windows 98 days, when there were tens of thousands of free apps and nothing deciding whether or not it was still safe to run. I had one program that loaded uninstalled fonts into virtual memory as though they had been installed, then unloaded them on command. Which meant that I could have a library of 10,000 fonts, with high odds that if I didn’t have exactly the right one for a given project, I had something that would come close – and when I didn’t need it, I didn’t have to deal with it.
These days, FontLoader is still useful, but under Win10, it’s sometimes a little buggy because memory management is a little different.
I still use the Win98 calculator because it’s more useful and intuitive than the one Microsoft currently provide, and all the others that I’ve seen on offer.
This stage of the technology-generation process turns that on its head somewhat, assuming that most people only use a small subset of what the tech is capable of, and use it in ways not originally envisaged because a second piece of technology makes that possible.
For years, my dad used a Dictaphone to record recipe instructions, step-by-step, so that my step-mother, who suffers from acute vision failure, could listen to a step in the kitchen, pause the playback, carry out that step, then restart the playback to get the next step.
What are people who think outside the box going to do with your shiny new tech, which of those applications will catch on, and what will the impact be on ordinary people’s lives? And what will the ripple effects be? That’s where the real societal changes will come from.
Now that the first blush of streaming services is well and truly gone, and the fact that not everything is always available through those services is starting to bite, I’m expecting a resurgence of popularity for physical media. A new media consumption process is going to exist in which new content is streamed, and consumed, but if you like it, a physical-media copy is obtained so that the content is always available on demand. In the old days, you used to rent physical media to decide what you wanted to buy – and this is essentially a variation on that process. But, for a while, streaming was everything, to the point that all the retail outlets that used to rent/sell DVDs went out of business. This forced adaption to the new consumption process, whether you want to change or not. That’s a social change.
10. Abuse
It can be said that it takes a particular mindset to look at something new and work out how it can be abused by clever people to do things it was never intended to do. In hindsight, of course, most of these illicit applications become obvious.
The existence of email creates spam, and scams, and phishing. You can’t have one without the other, and that necessitates protection against those abusive applications. So we have a couple of forms of abuse, and a ripple effect in consequence.
The key to making the prediction of abuse impacts and their ripples easy is to get good at reasoning by analogy. Look at how familiar tech gets abused, and extrapolate to analogous effects from your new tech. You don’t have to be right, just plausible – but there will always be SOMETHING.
11. Selling The Technology
The final step is imagining how the marketing gurus will package the product. What will the adverts be saying about it? What will they over-promise and under-deliver, and what expectations will they create for the tech?
It might seem, at first, like there’s nothing to be said in this space, if a tech is not aimed at the general consumer. That’s not the case – you simply have to alter the context of your imaginary marketing. Consider a trade show, for example. A representative of a type of manufacturer or process laborer sees a new tech, discerns that it can make their job more efficient or more capable, and therefore this becomes a selling point for the products they create. And that creates ripple effects on society.
A better way to slice bread can revolutionize another industry that requires the cutting to shape of soft materials.
This article doesn’t actually end here – there is a whole other section to be written at some future date which applies these principles to the integration of magic into a fantasy society – plus mechanical marvels and anything else you can think of.


